High quality PDF publications with Charts
Published December 26, 2014
Since I started studying traditional astrology, I always had the opinion that astrological knowledge should be shared. However, a key issue is that a clear chart is essential for both the beginner as for the professional astrologer, and most of today's software are not really directed to the export of high quality graphics.
Charts is a new web application that allows us to create high quality astrology charts in a minimalist and distraction-free interface. The generated charts can be used in blogs, web forums or for personal publications. Charts is freely available at http://apps.flatangle.com/Charts/.
In this article I will show, step-by-step, two approaches to create high quality PDF astrology publications using Charts:
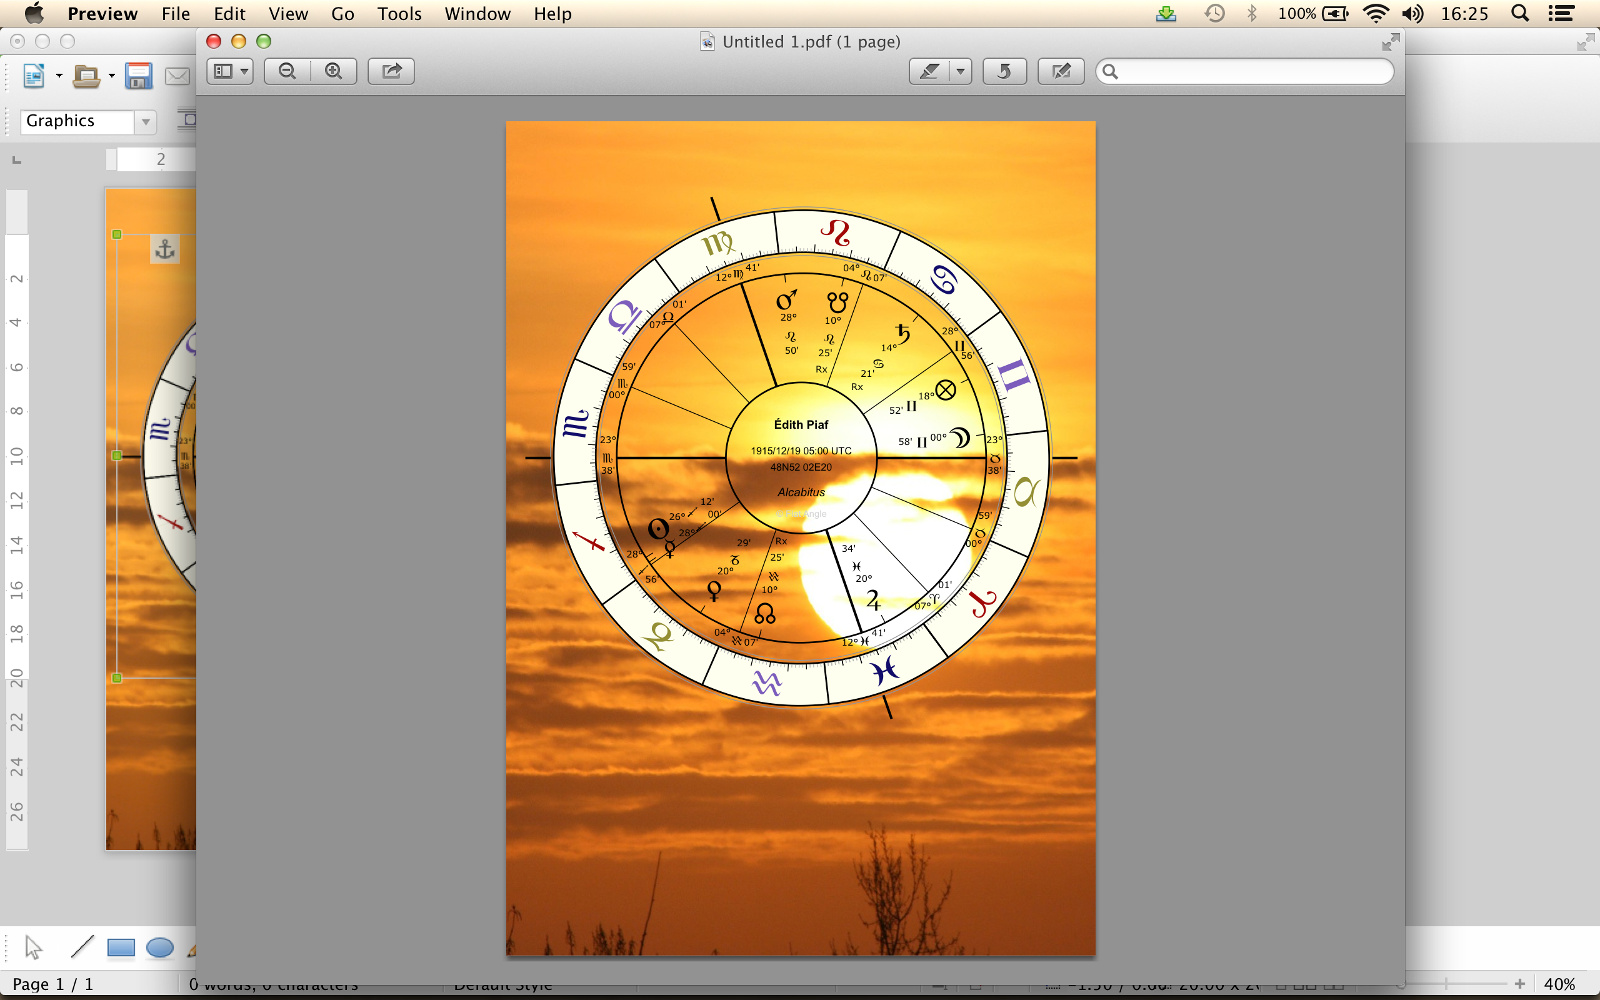
The PDF output for both methods will be as in the following image.
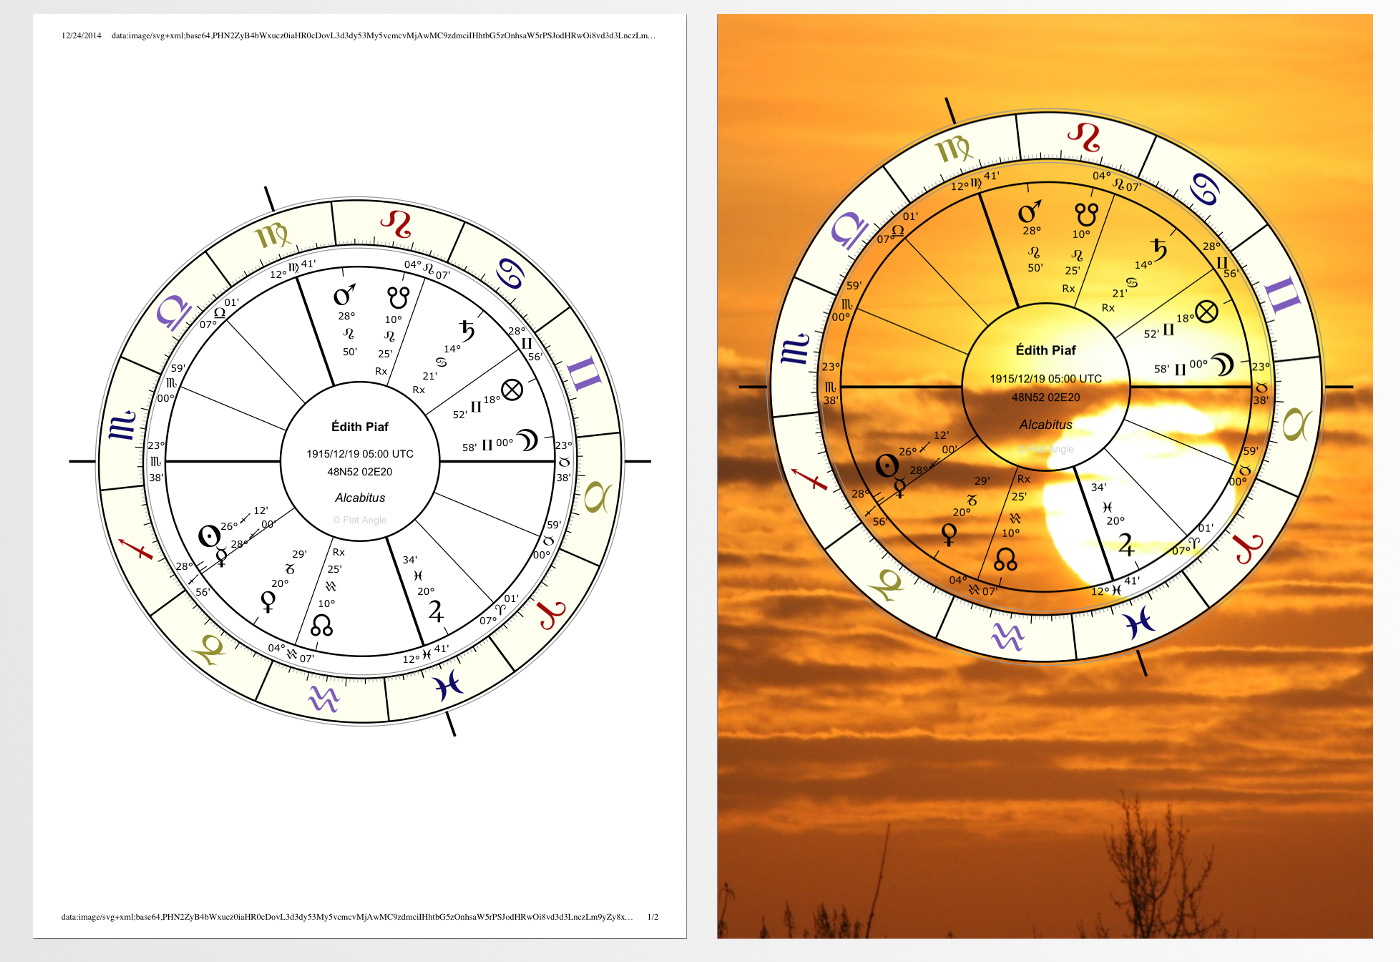
PDF's output.
These approaches are possible because Charts is built using state-of-the-art standard technologies. Although the steps in this article are made on a Mac using Google Chrome, similar features should be available on other browsers and operating systems.
1 - Print to PDF directly on the browser
This first approach consists in generating a PDF using the native printing ability of the browsers.
1.1 - Generate a chart
Open Charts at http://apps.flatangle.com/Charts/ and create your chart:
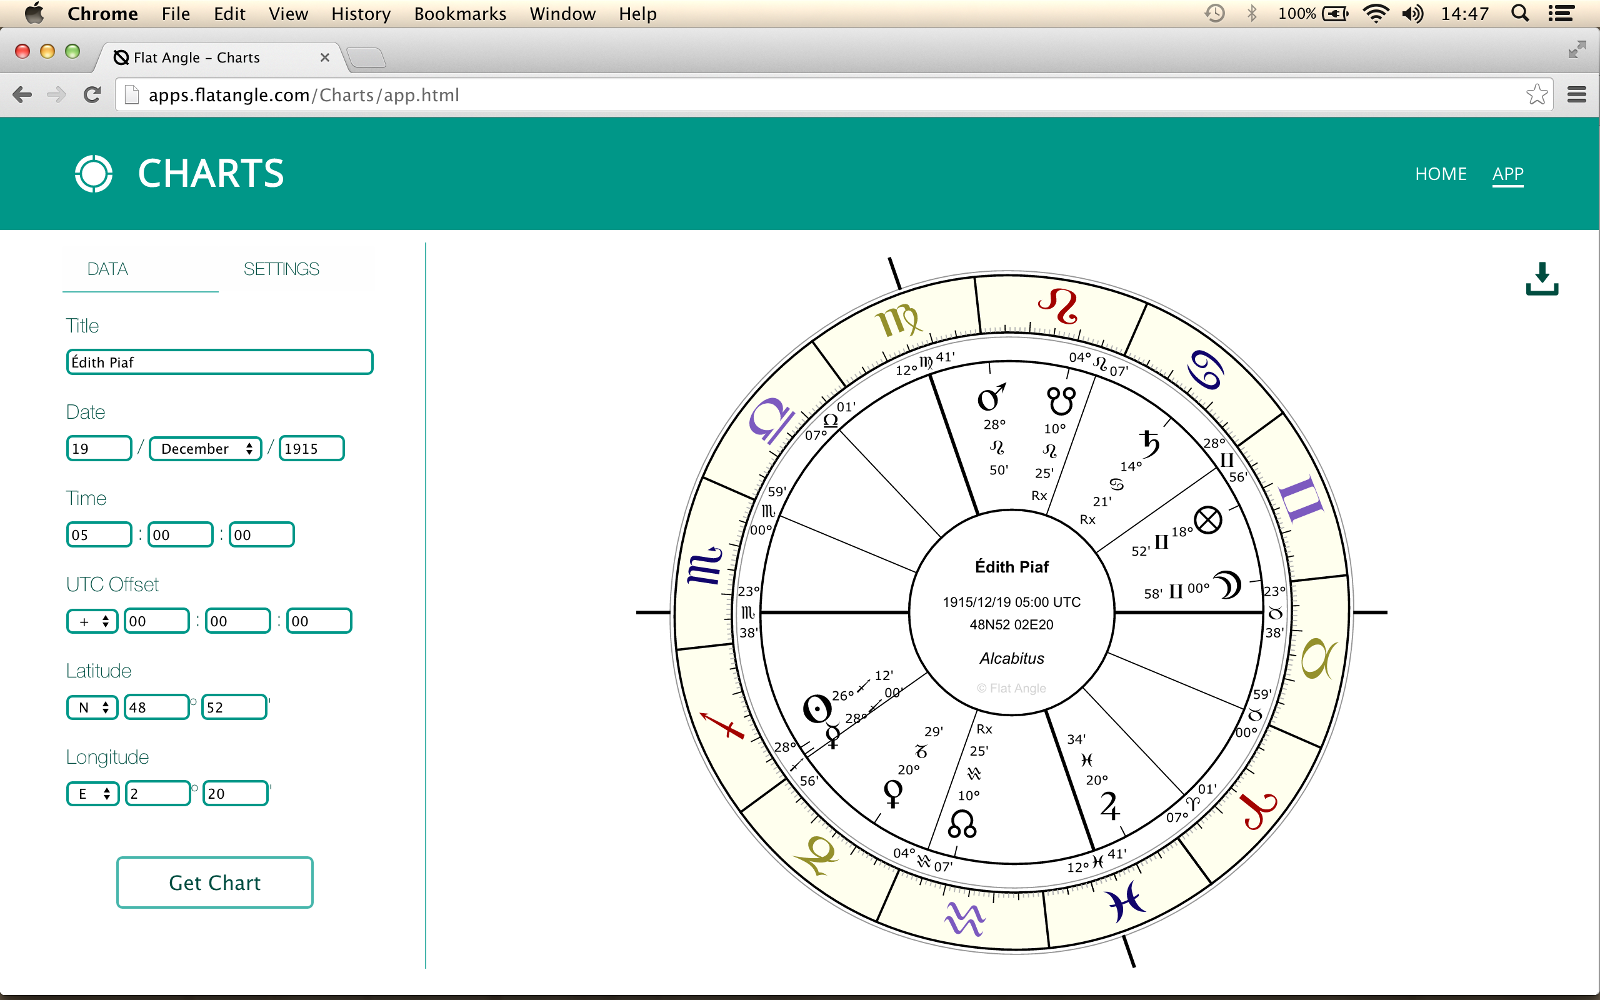
Charts app overview.
1.2 - Open image in new tab
Click the right mouse button on the map, and select Open Image in New Tab.
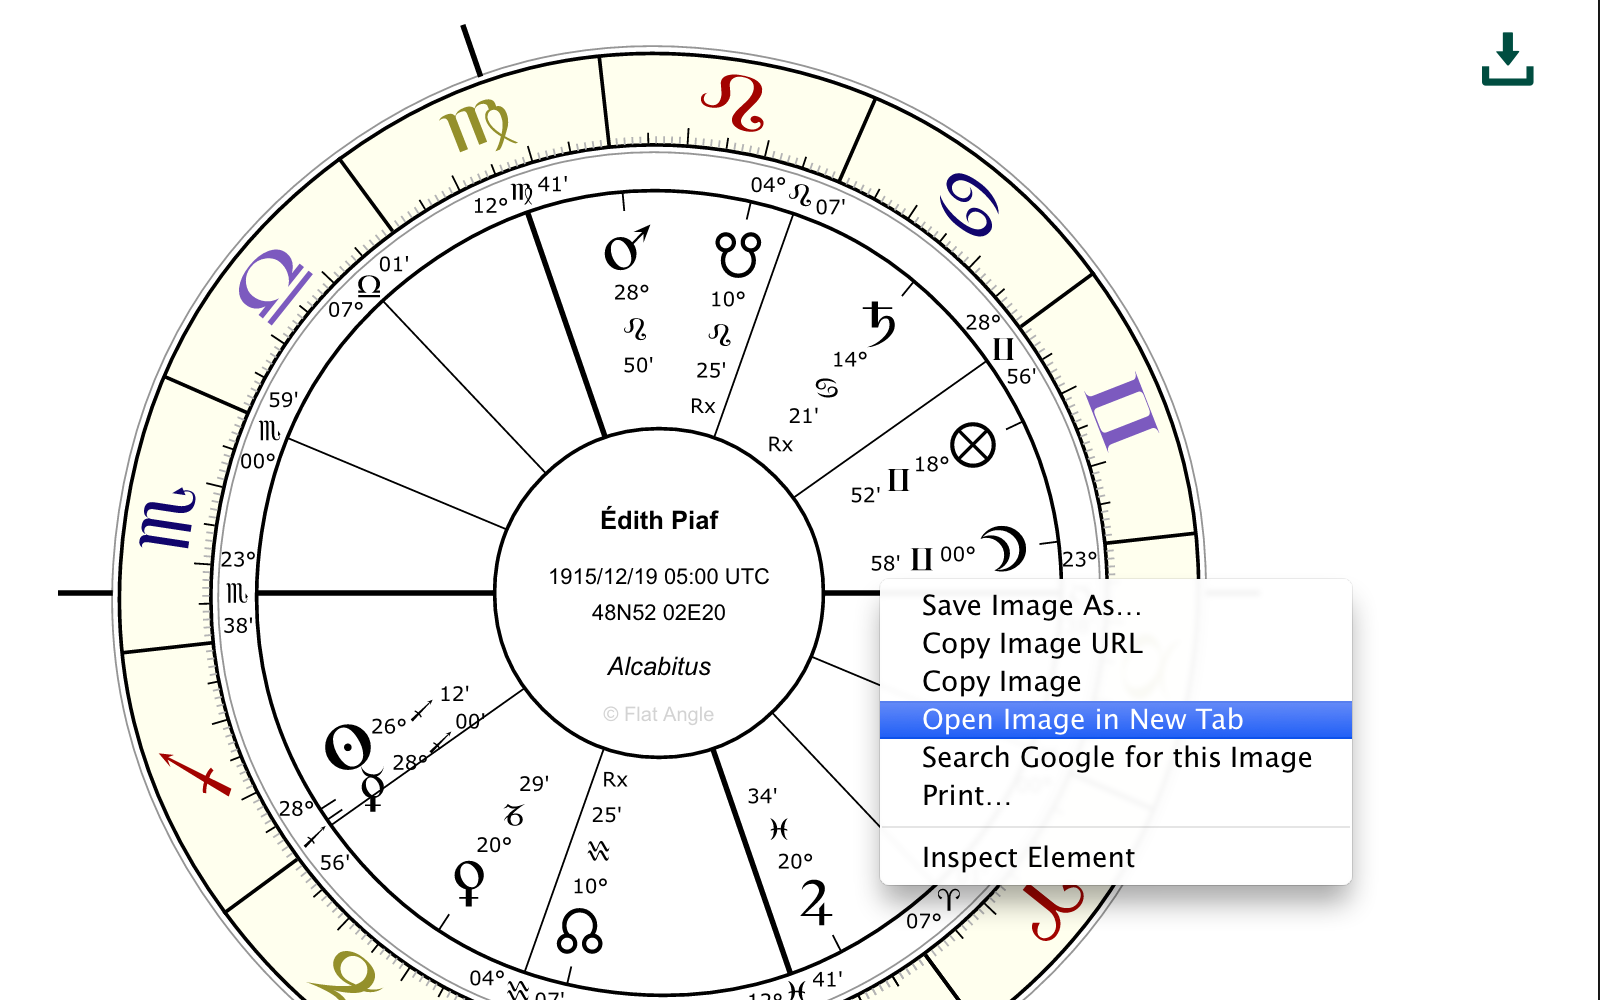
Open image in new tab.
This will open a new browser tab with your chart.
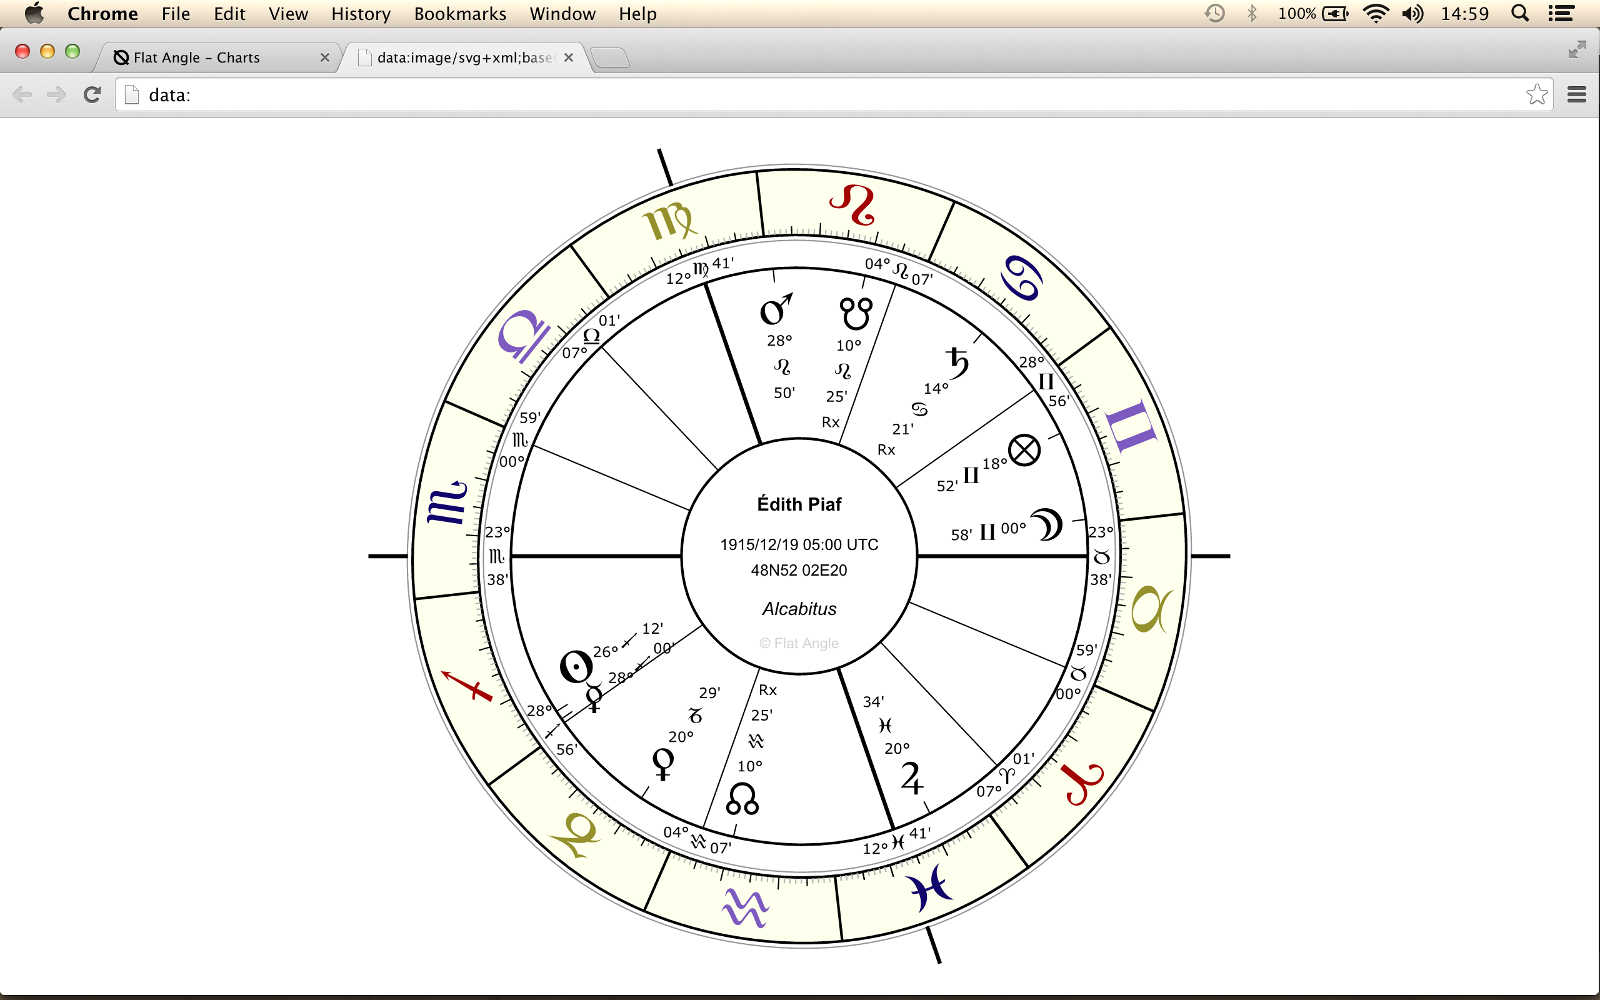
Image in new tab.
1.3 - Open the Print Dialog
On the File menu, select Print to open the Print Dialog.
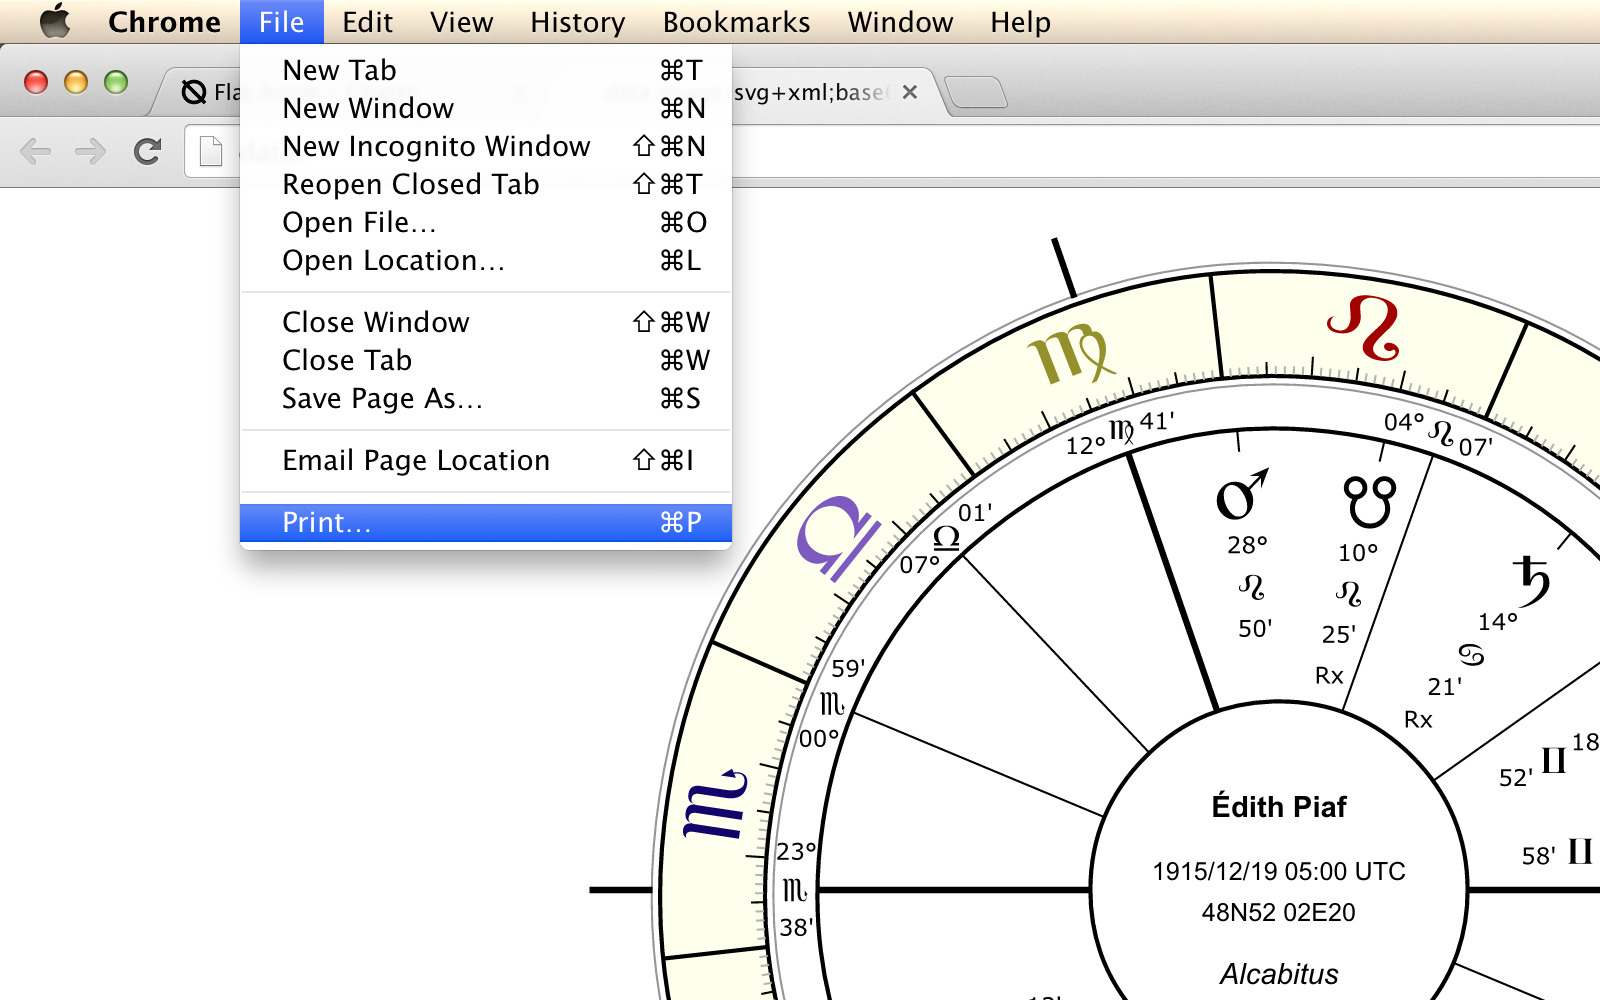
Printing a chart.
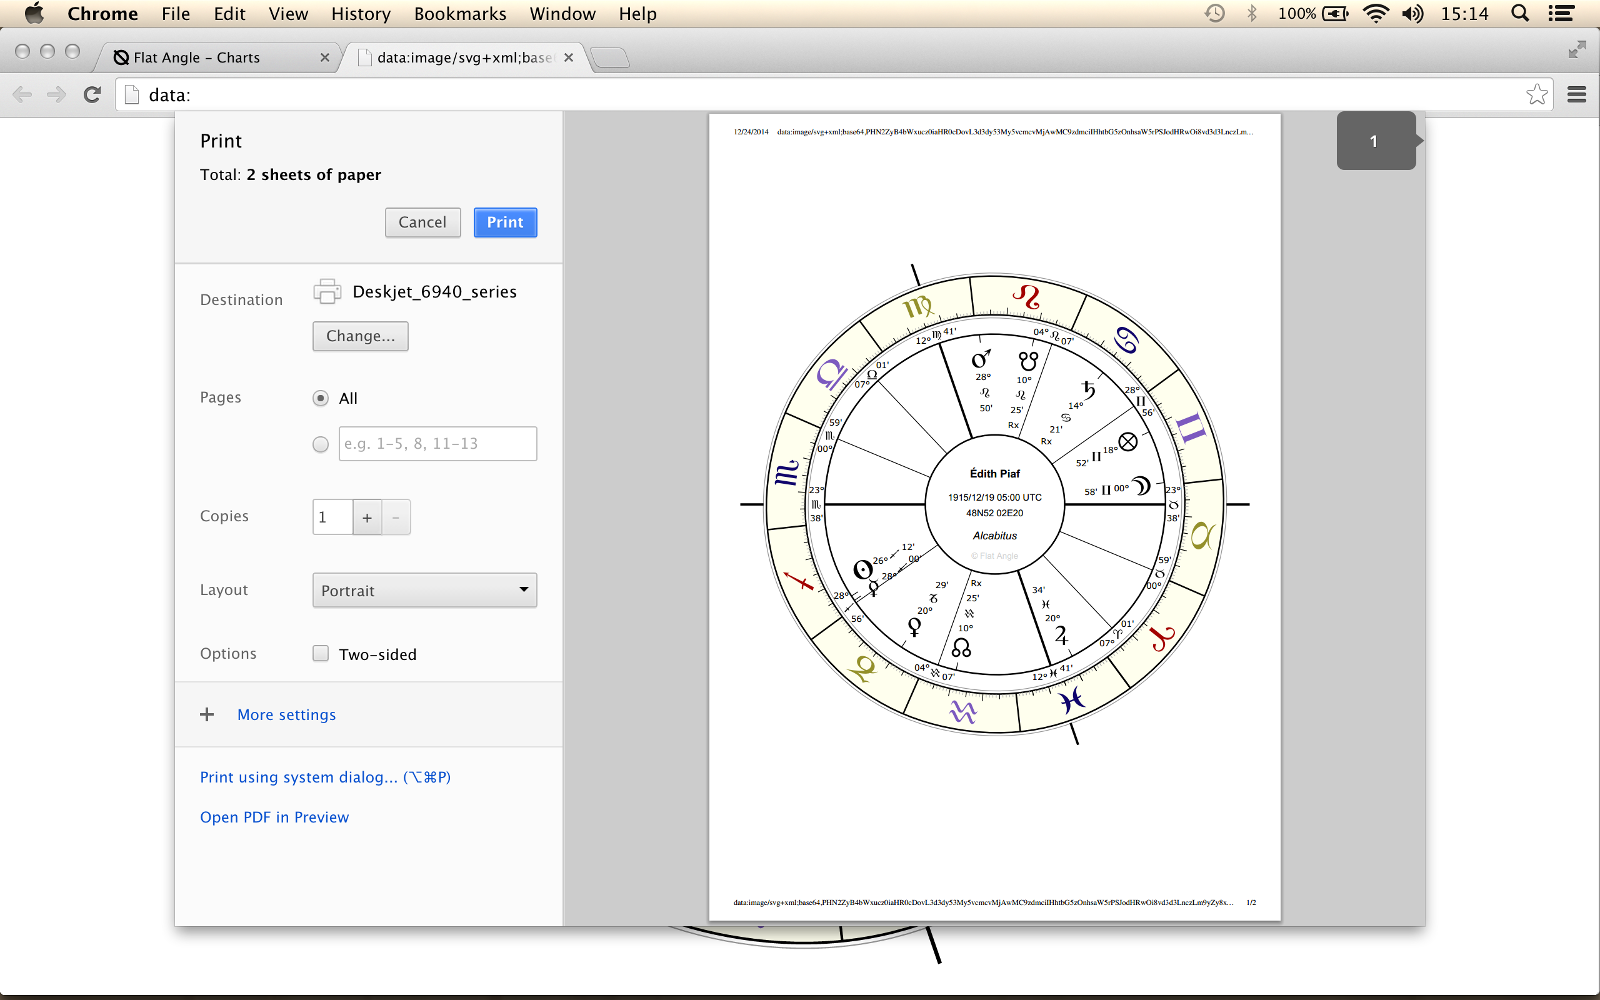
Print dialog.
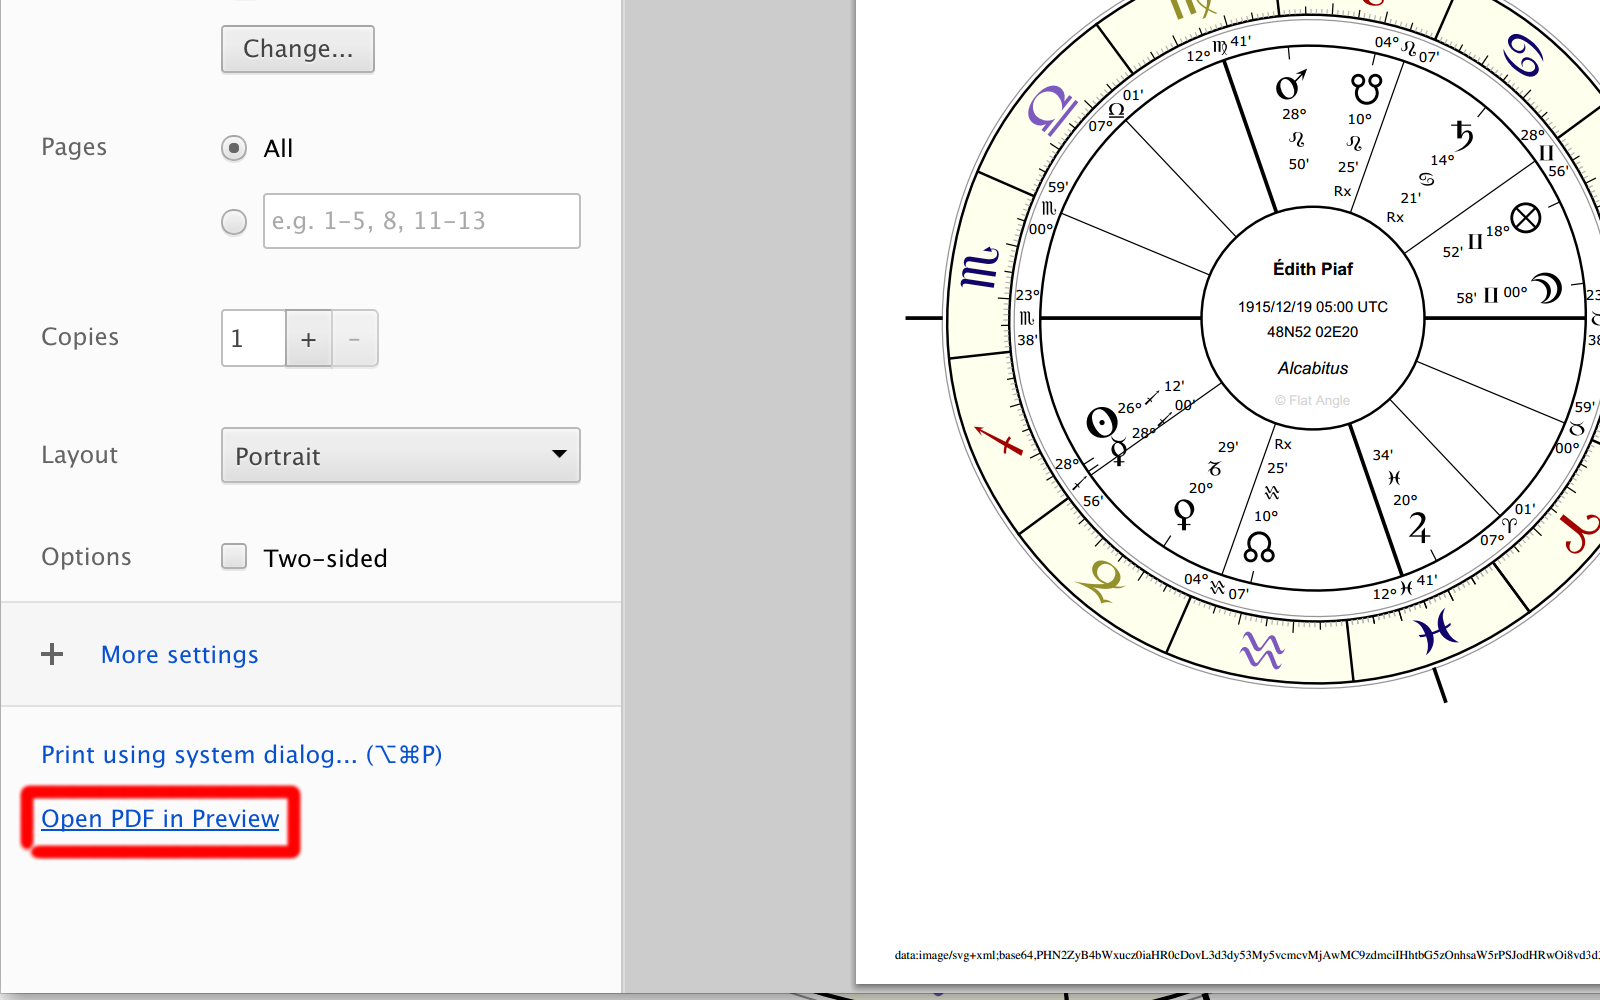
1.4 - Print to PDF
To print the chart to PDF, you can export it directly on OS X and Linux. On Windows it may be required to select Print and select a virtual PDF printer.
Unix-based operating systems like Linux and OS X have built-in support for PDF export, while on Windows it may require a virtual printer such as PDF Creator.
Printing to PDF.
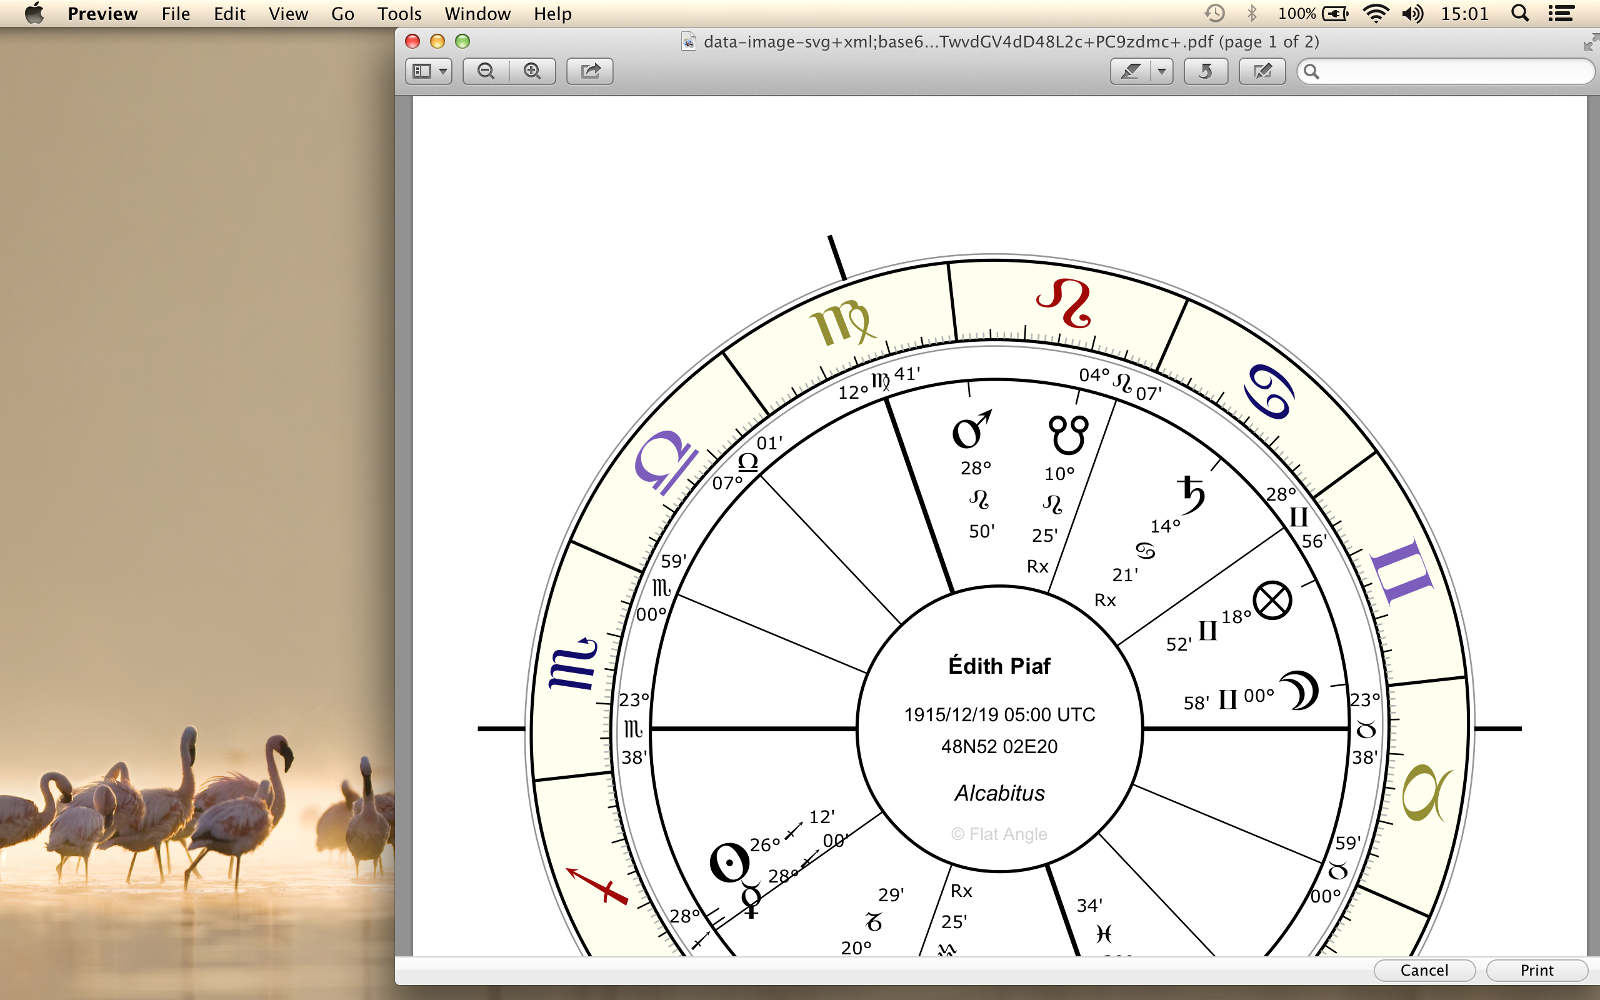
PDF output.
And your PDF is done.
2 - Print to PDF using a Word Processor
This second approach uses a word processor to create a PDF publication of high quality. In this particular example I'll show how to create a chart with a background image. You can jump directly to step 3 if you have no interest in including background images.
This example uses the free LibreOffice suite, but similar features should be found in other word processors.
2.1 - Create a document with a background image
Open your Word Processor, and insert a background image from file.
Empty document.
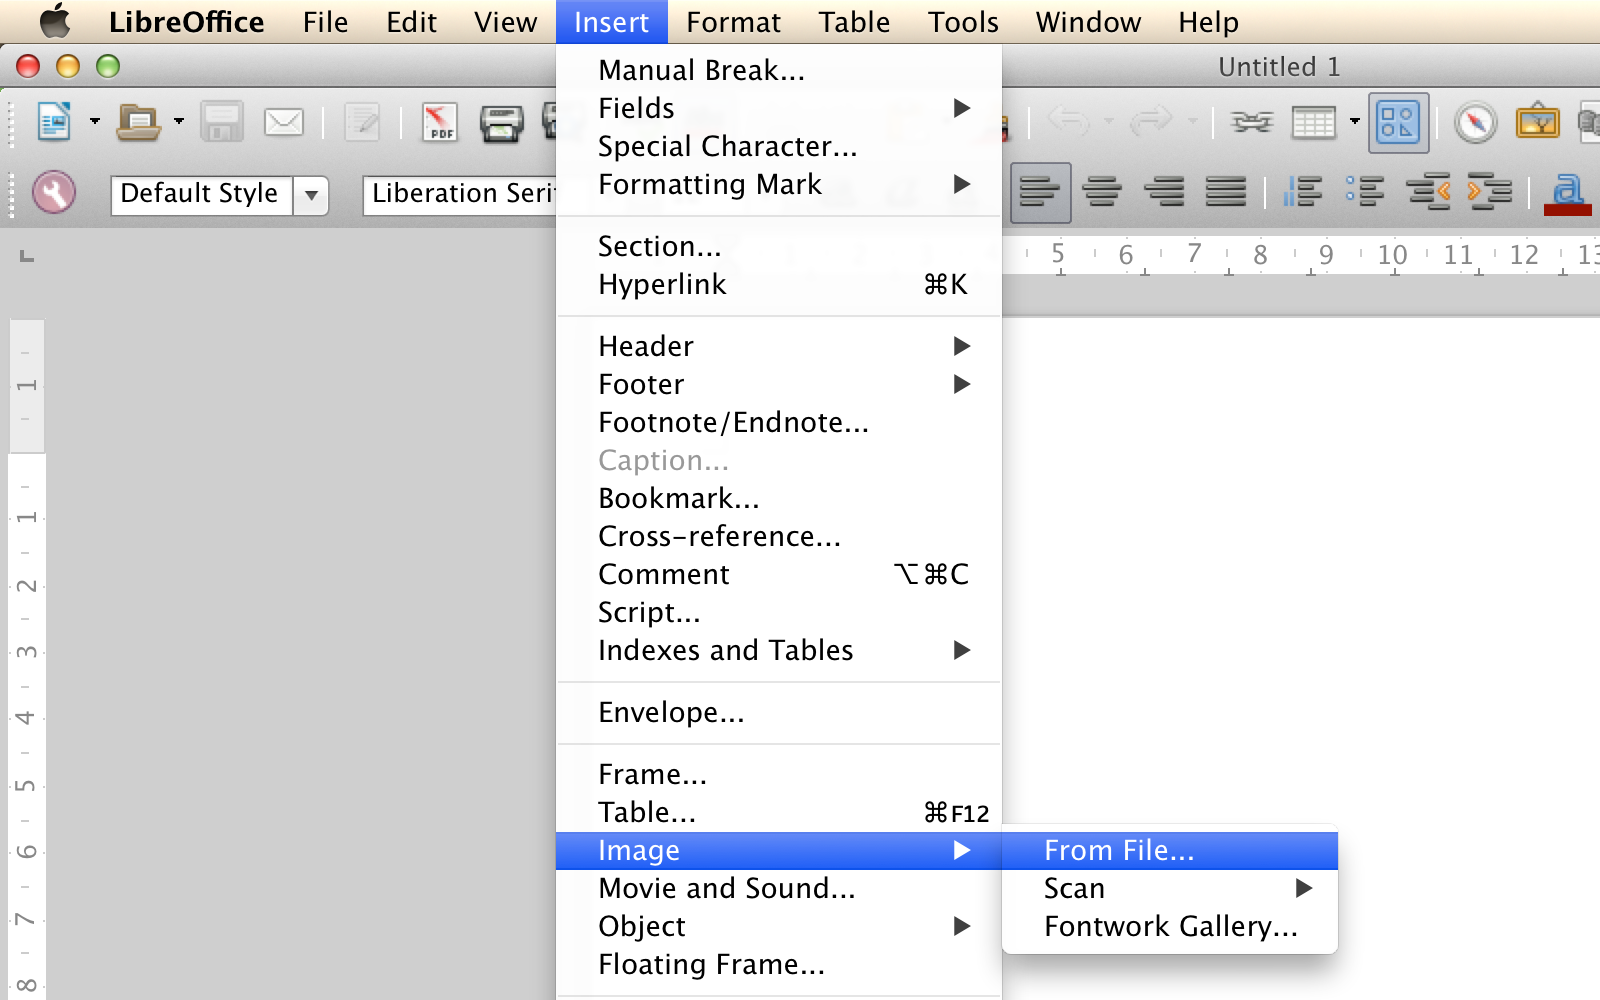
Insert image.
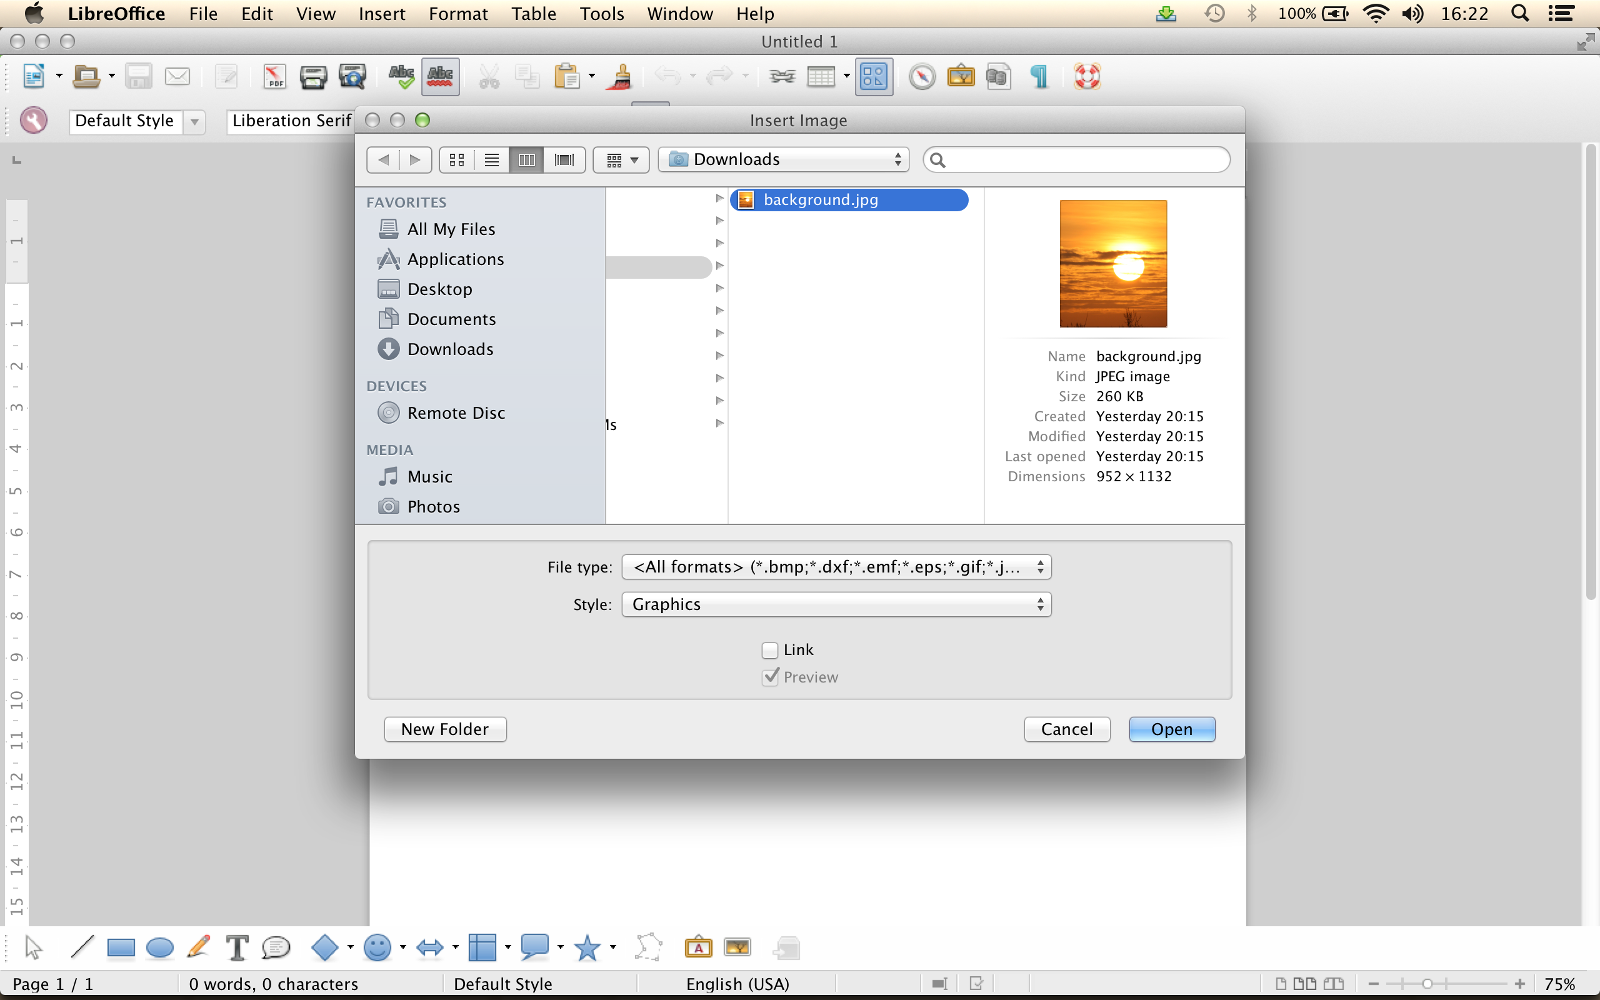
Choose background image.
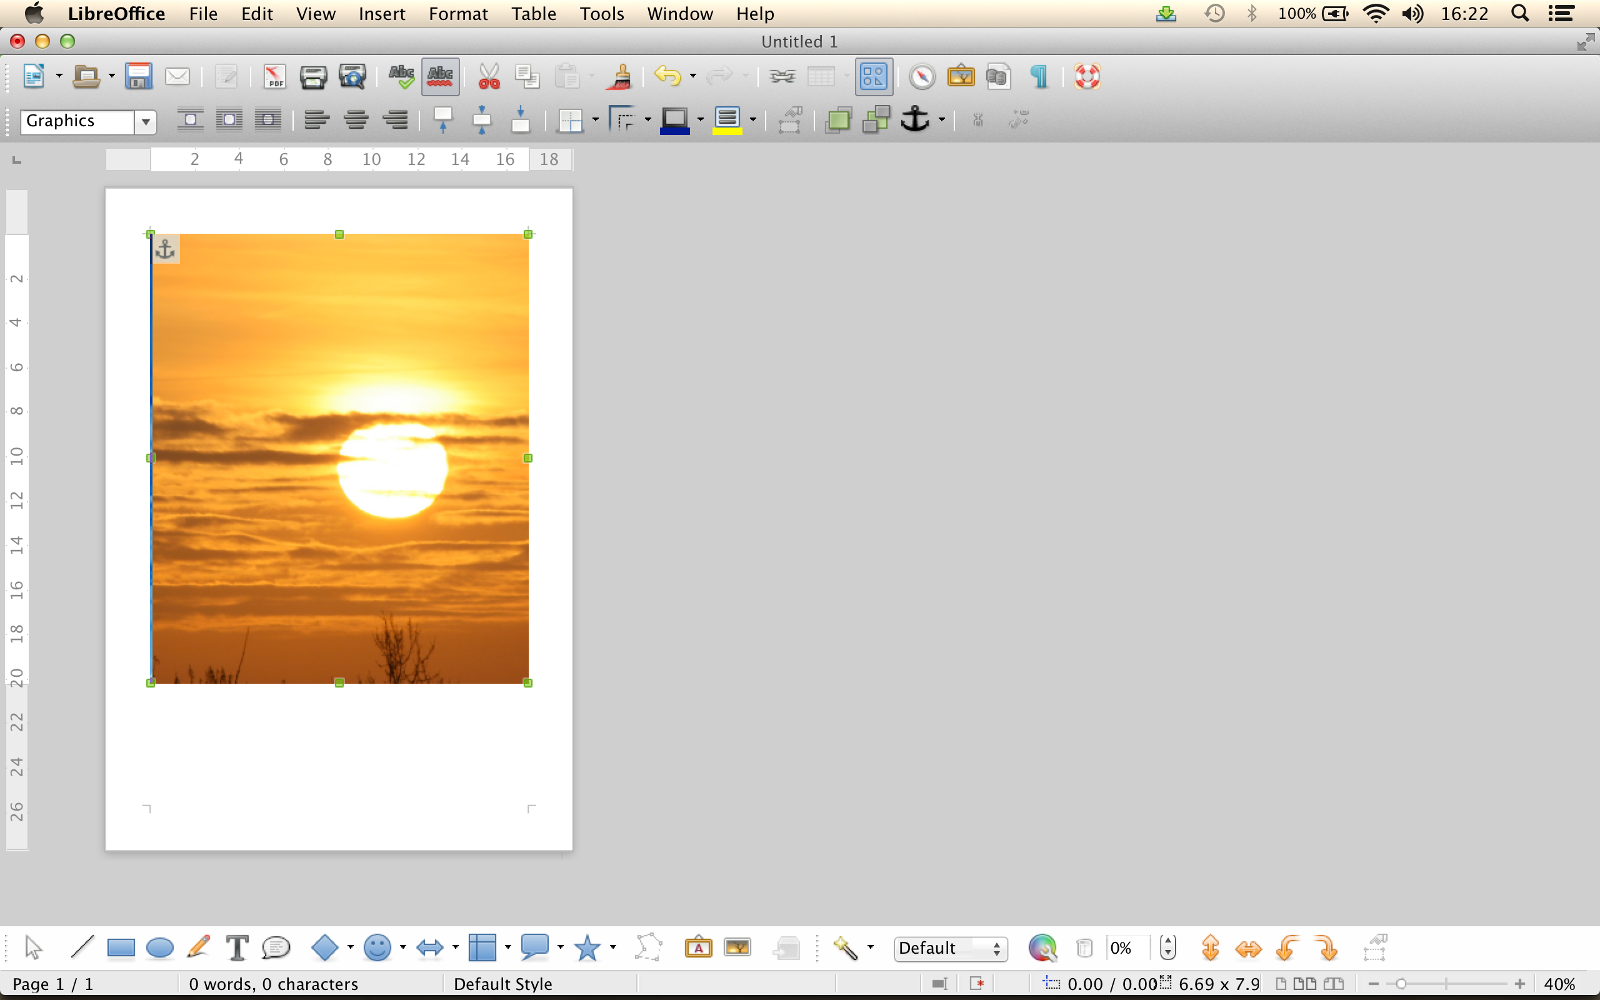
Done.
2.2 - Set background image to full size
If the background image does not fill the entire page, you can click the right mouse button on the image to get to the Picture dialog. On the Picture dialog you can scale the background image to fit the page.
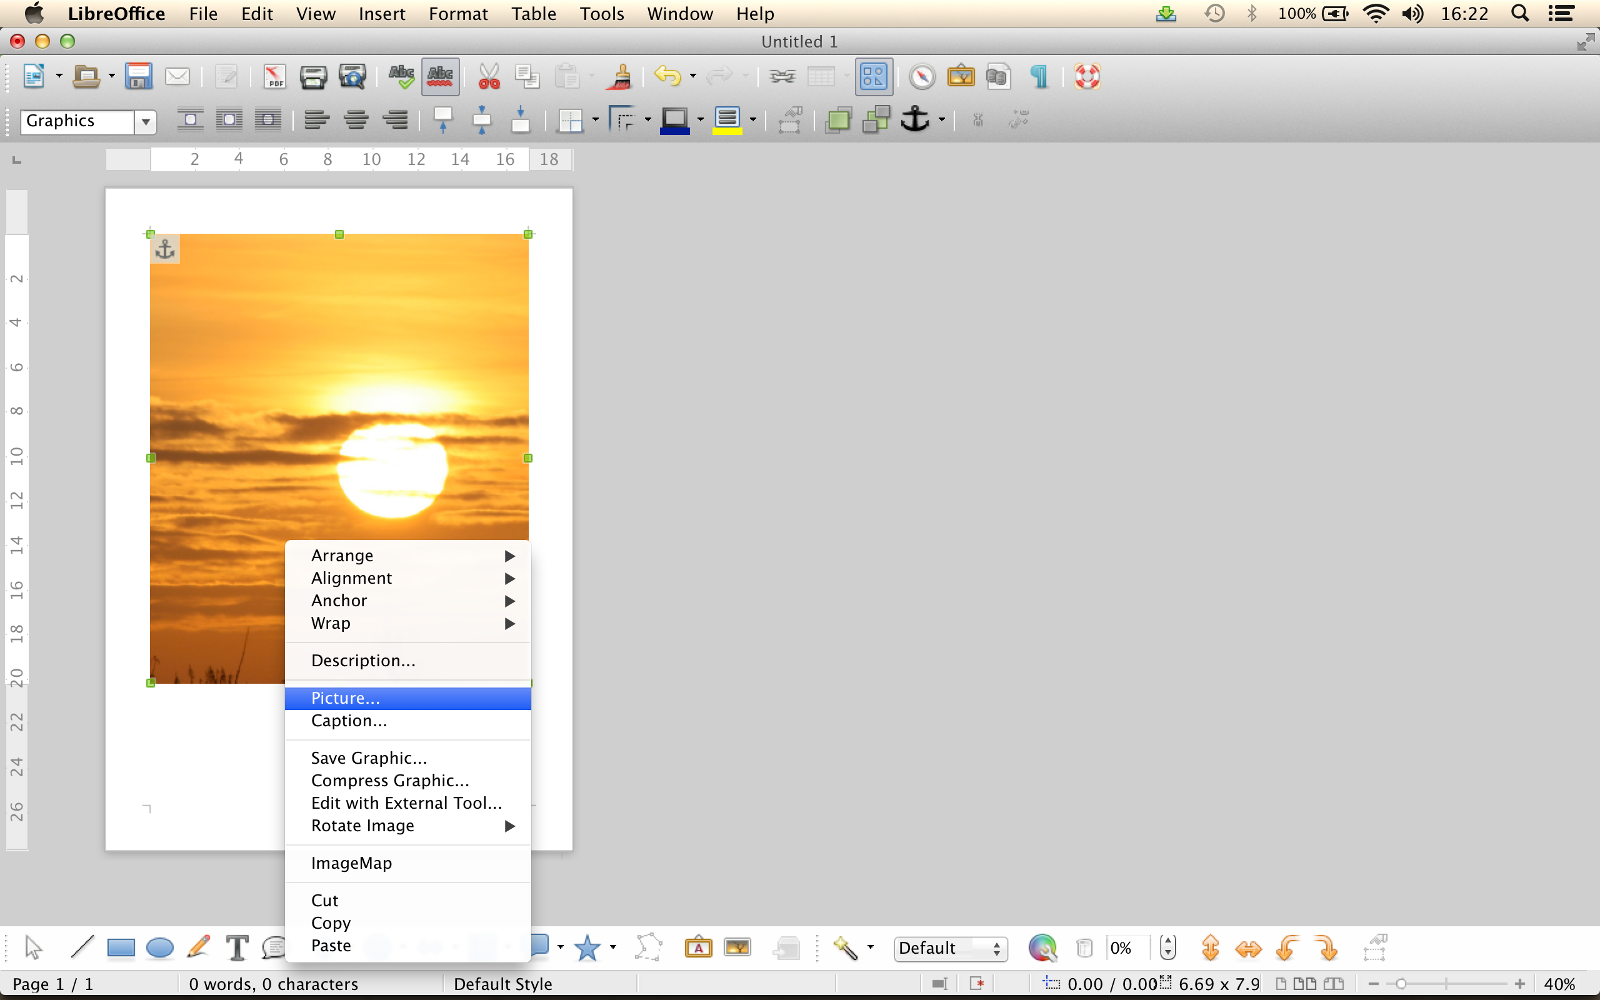
Right-click over the image.
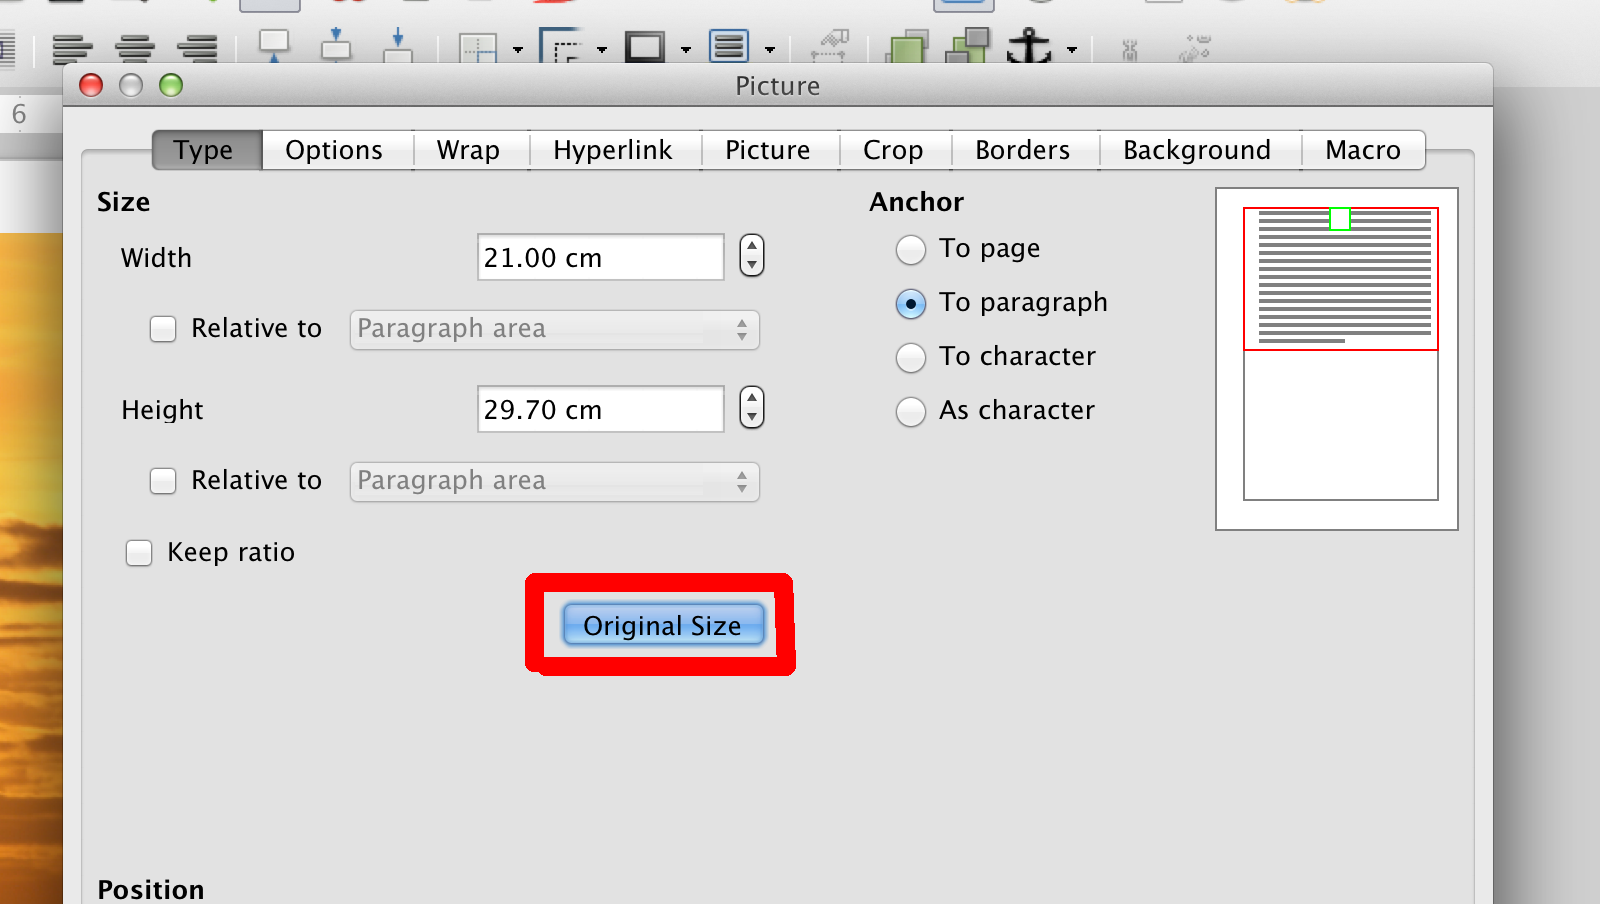
Set the width/height or scale to original size.
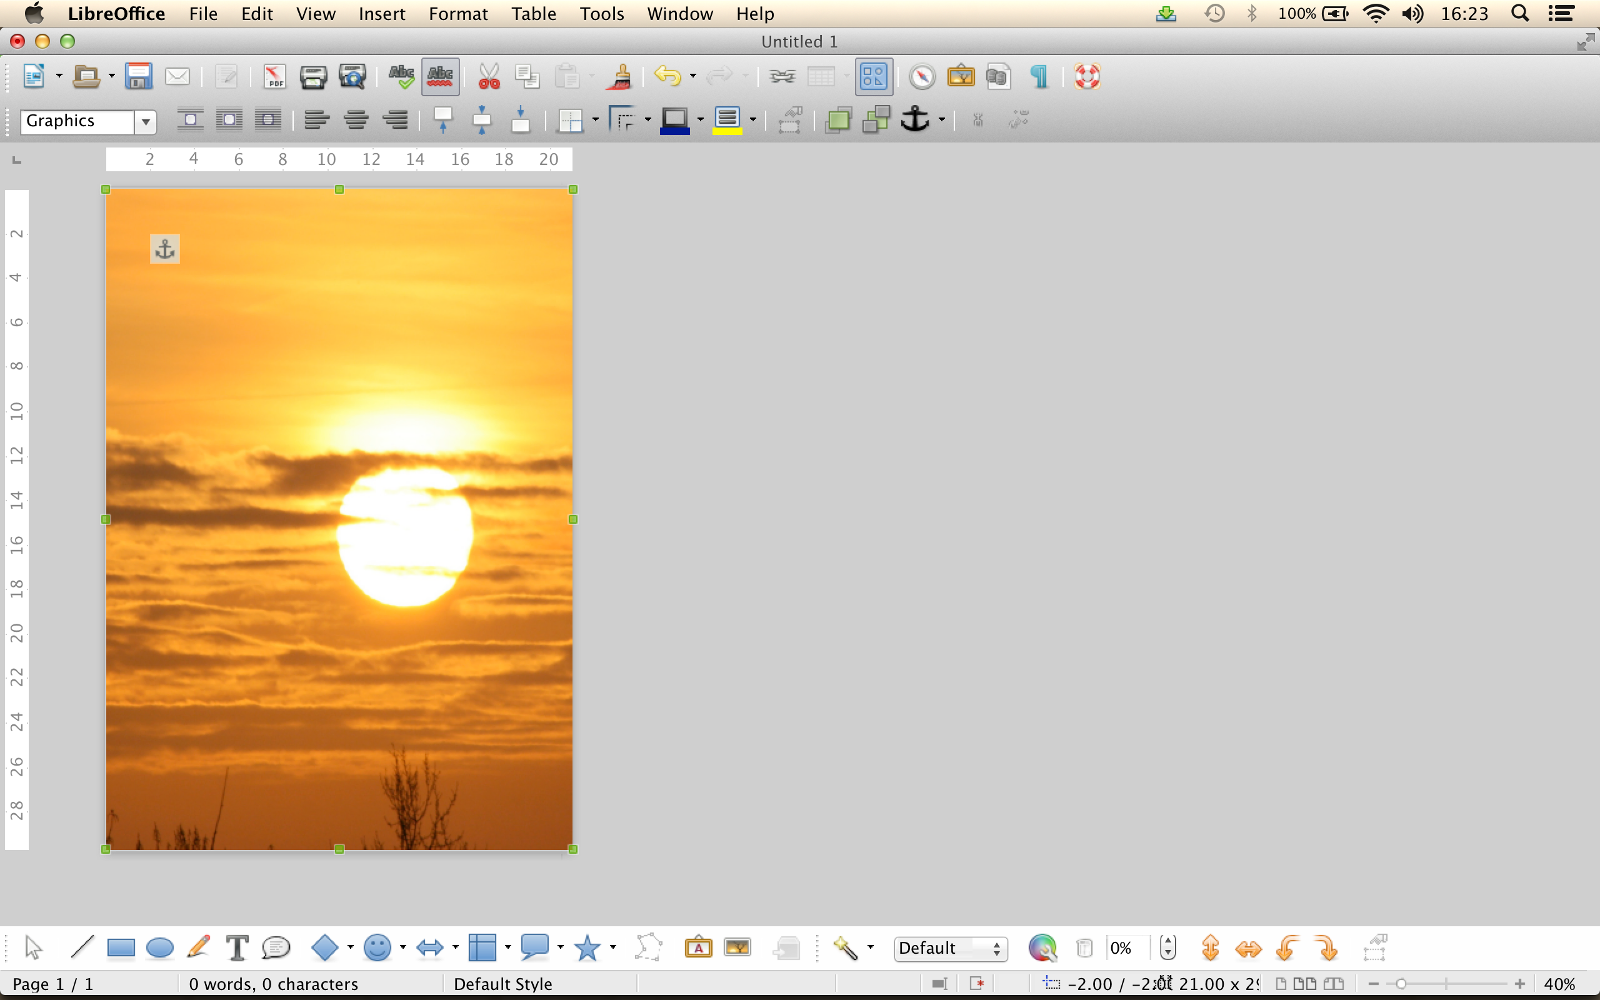
The background image fits the page.
2.3 - Export chart to SVG
Open Charts at http://apps.flatangle.com/Charts/ and export a chart in SVG with transparent background. If your word processor does not handle SVG images, you can also export the chart to PNG. Note that a PNG chart loses details if you need to enlarge it.
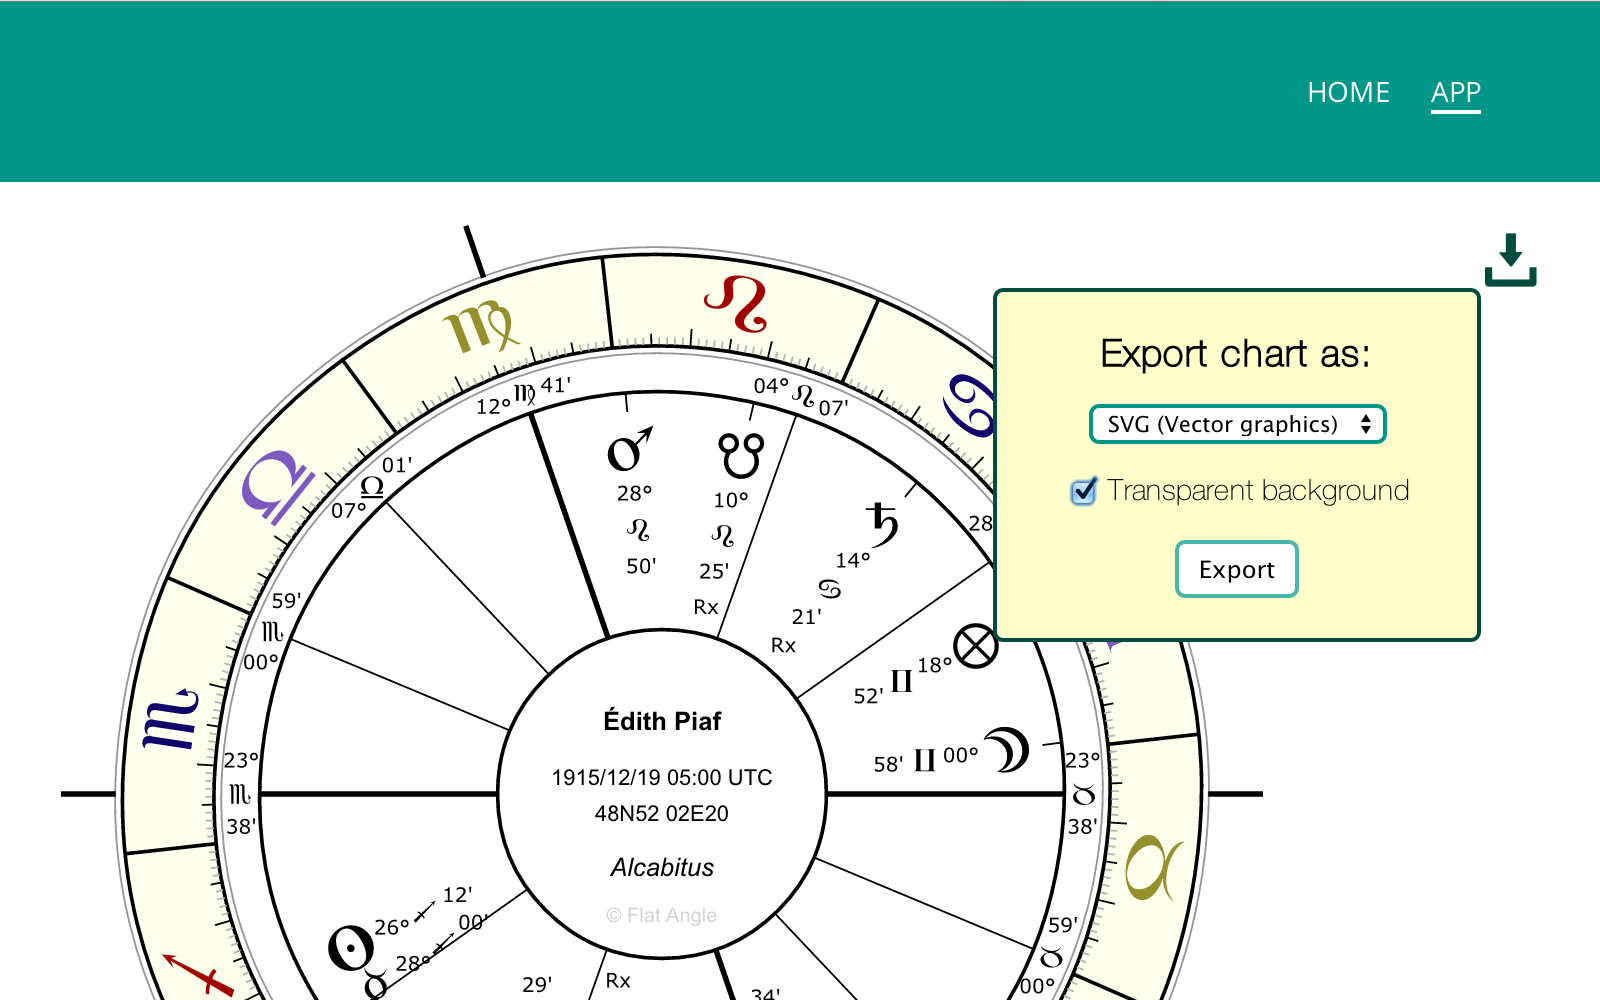
Export chart to SVG with transparent background.
2.4 - Insert the chart in the document
Back to the word processor, insert the chart into the document and make adjustments if necessary.
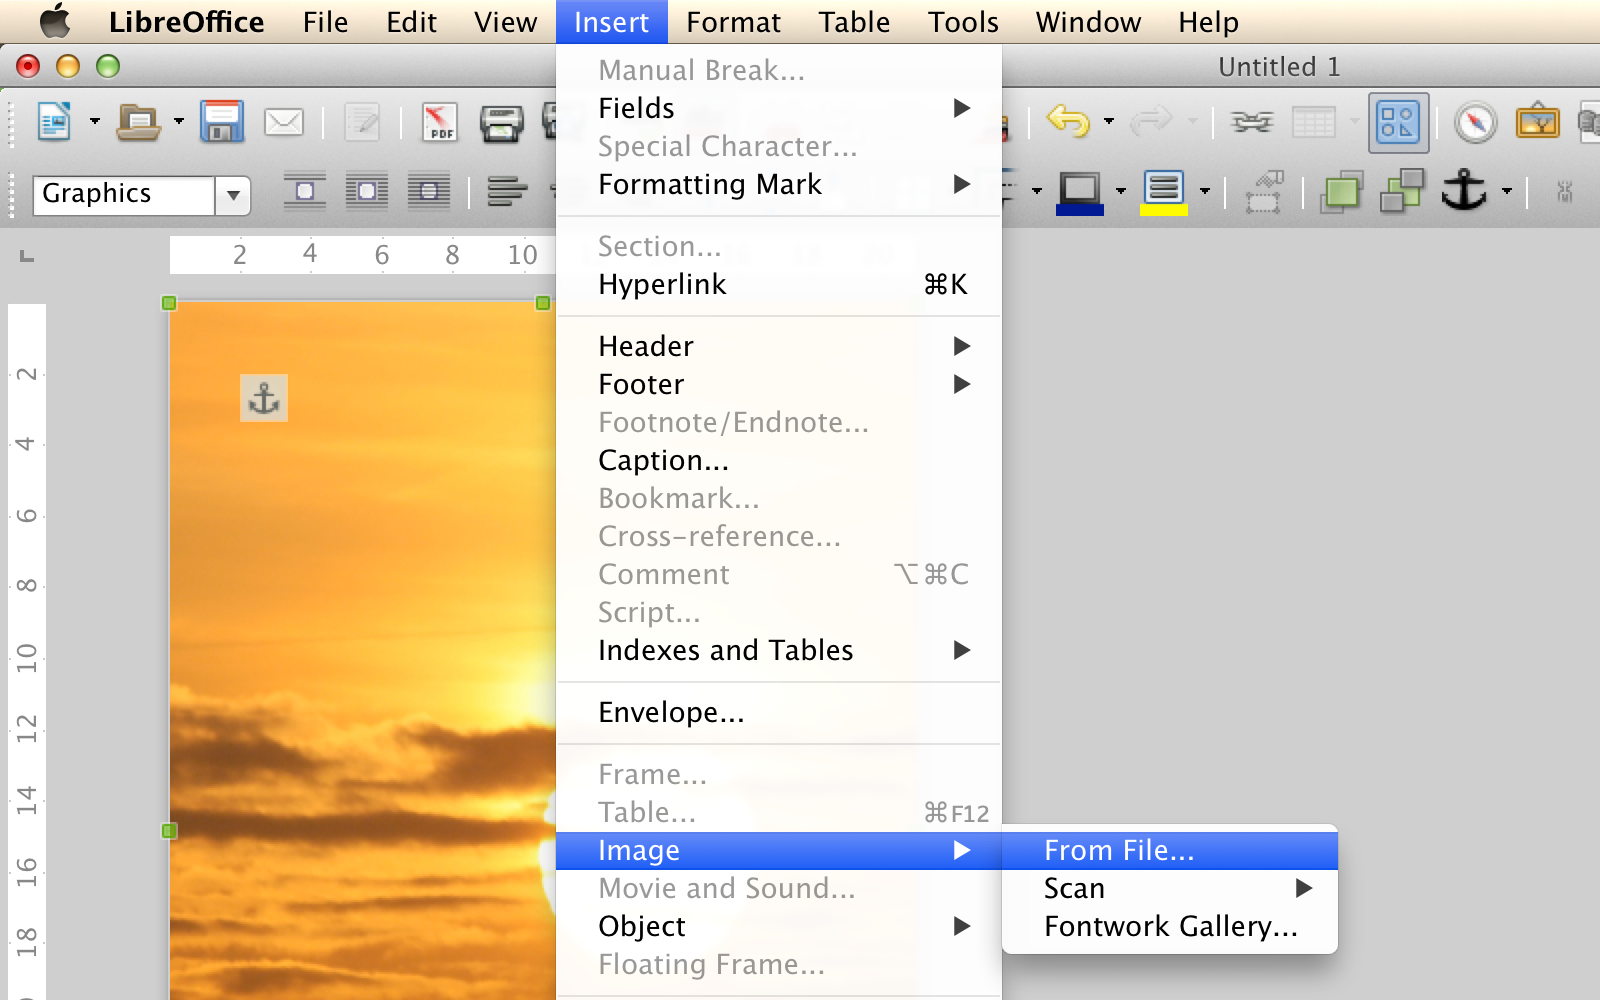
Insert image from file.
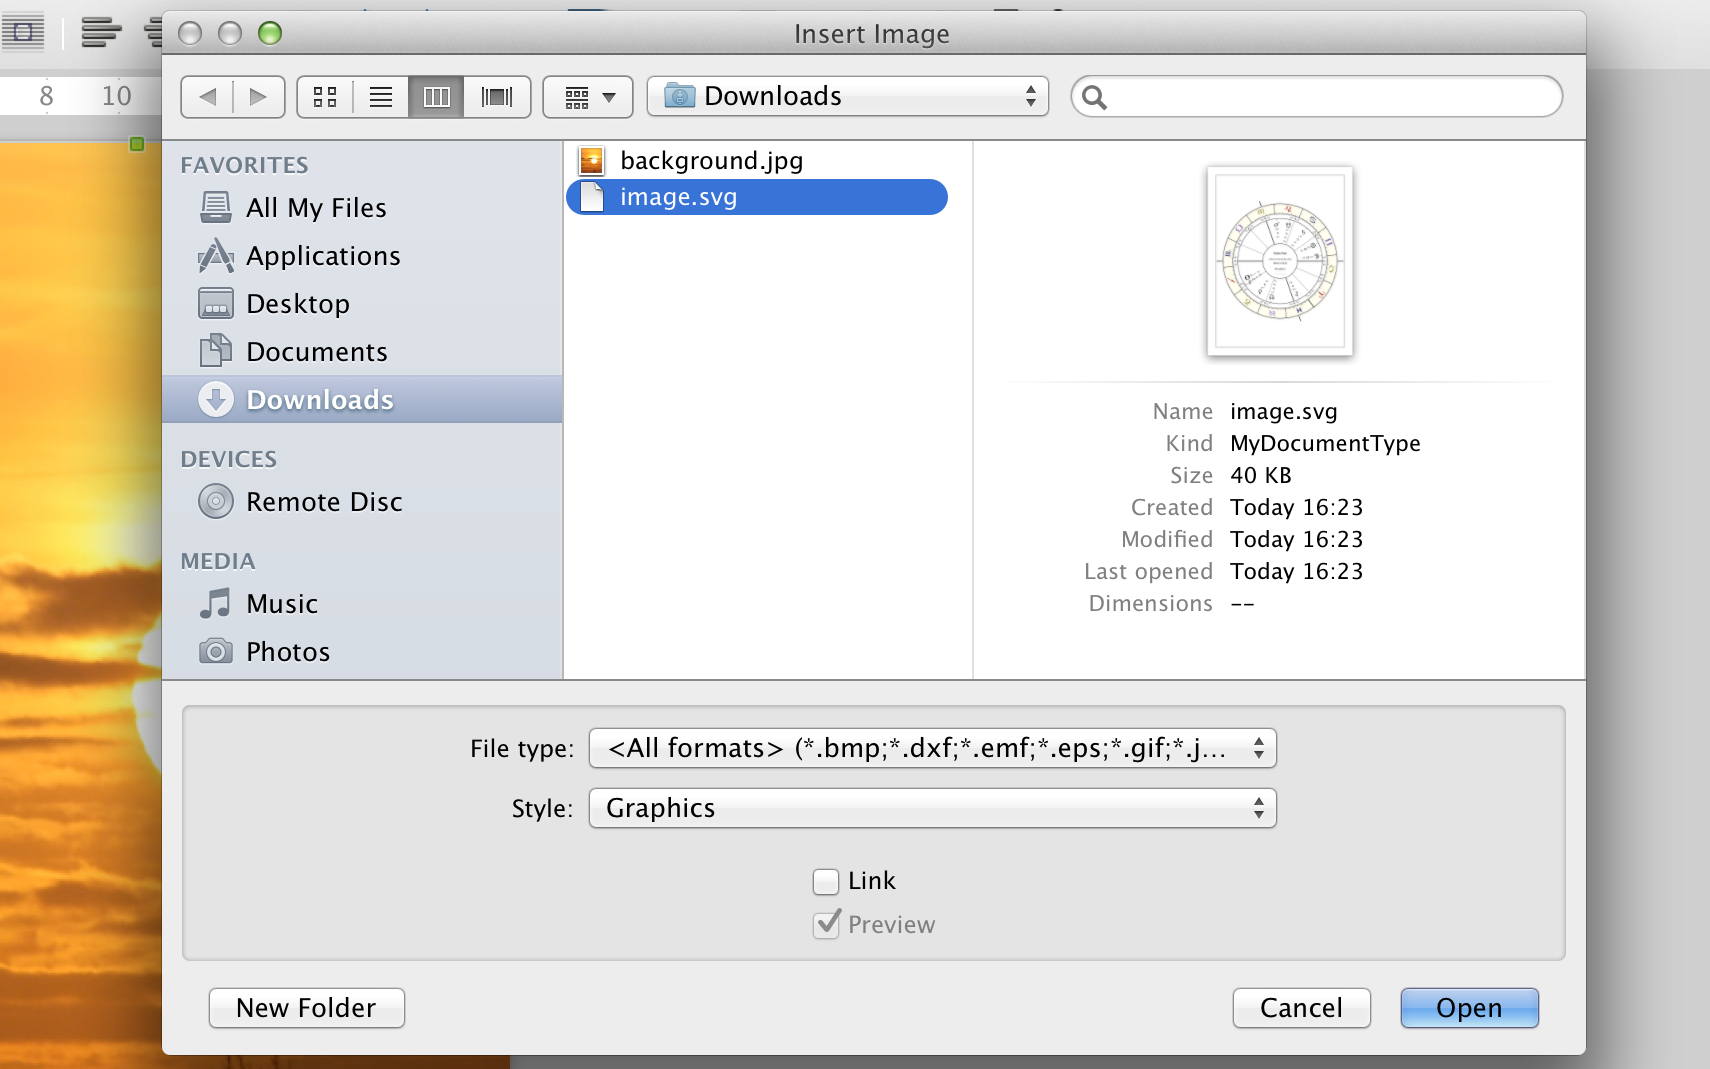
Select the chart file.
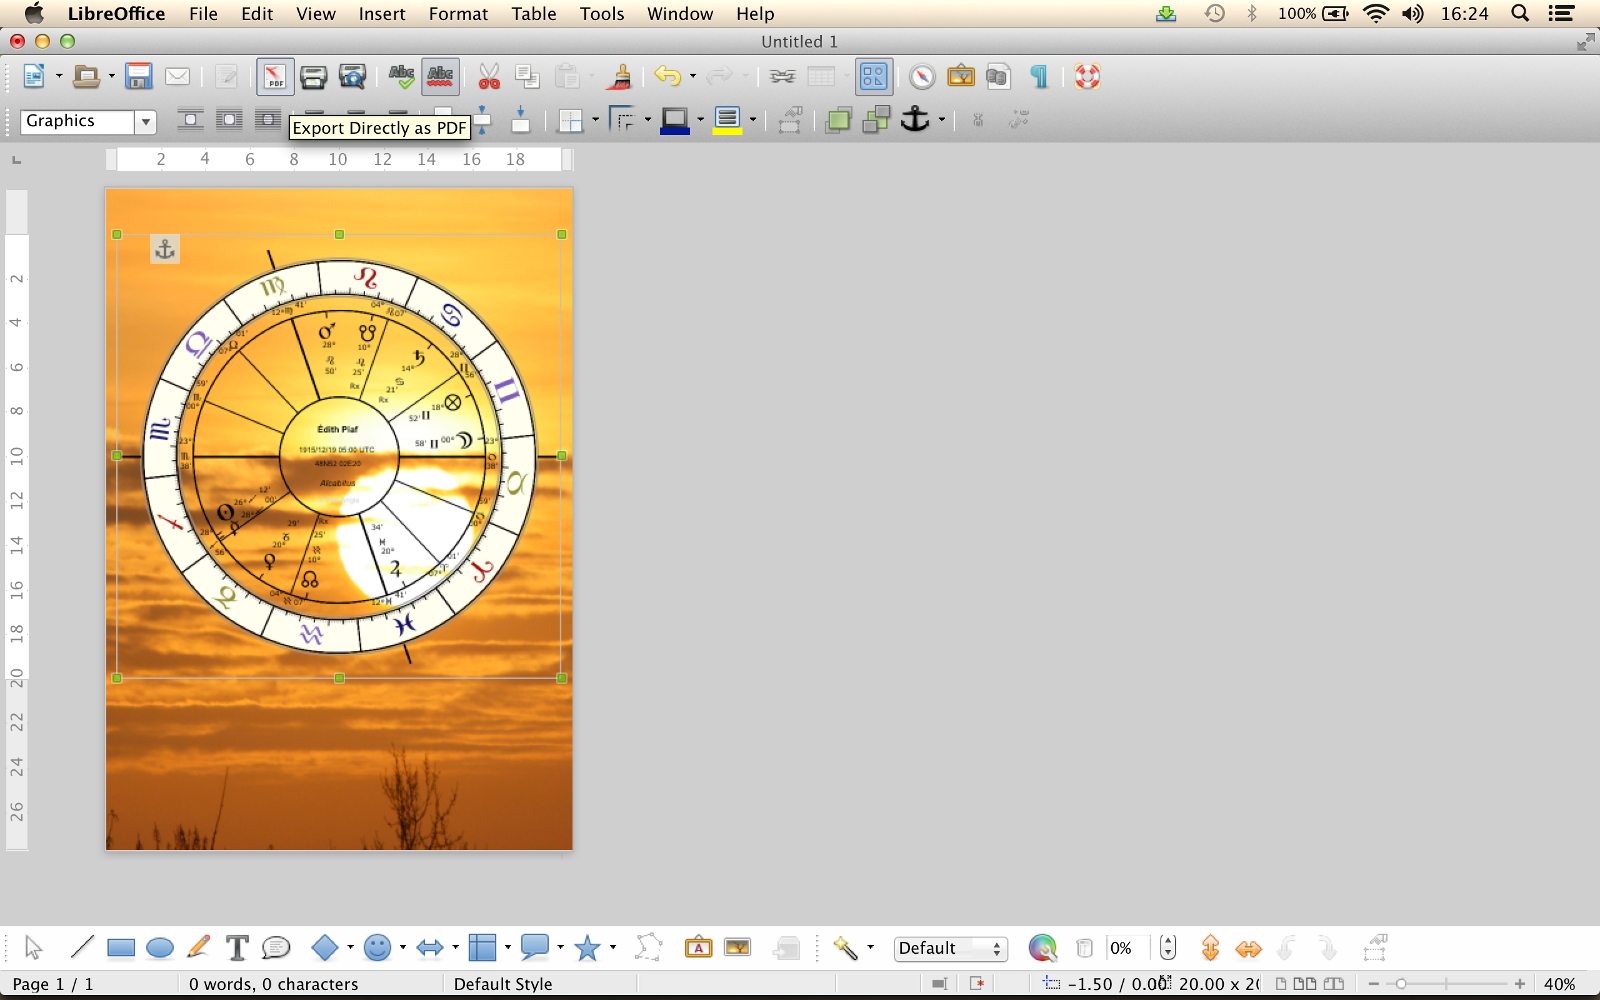
Make adjustments if necessary.
2.5 - Export to PDF
Finally, export your document to PDF. If your word processor does not export directly to PDF, consider installing a virtual PDF printer such as PDF Creator.
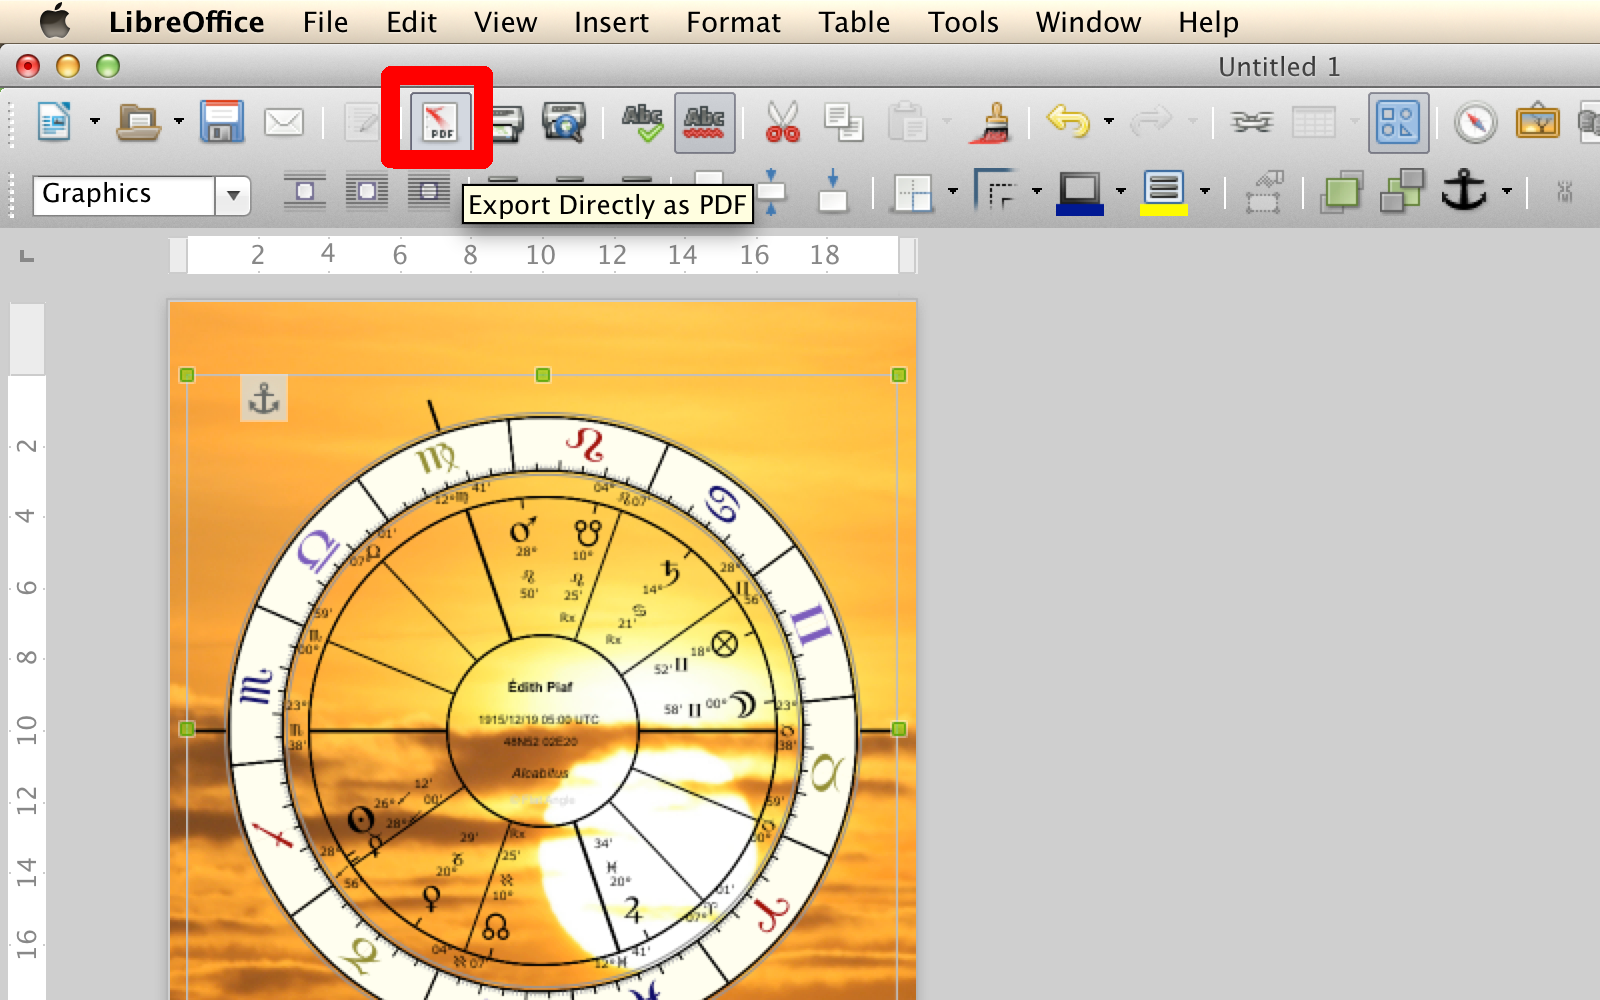
Select Export to PDF.
And you are done!
PDF files based on SVG charts will scale without losing resolution.
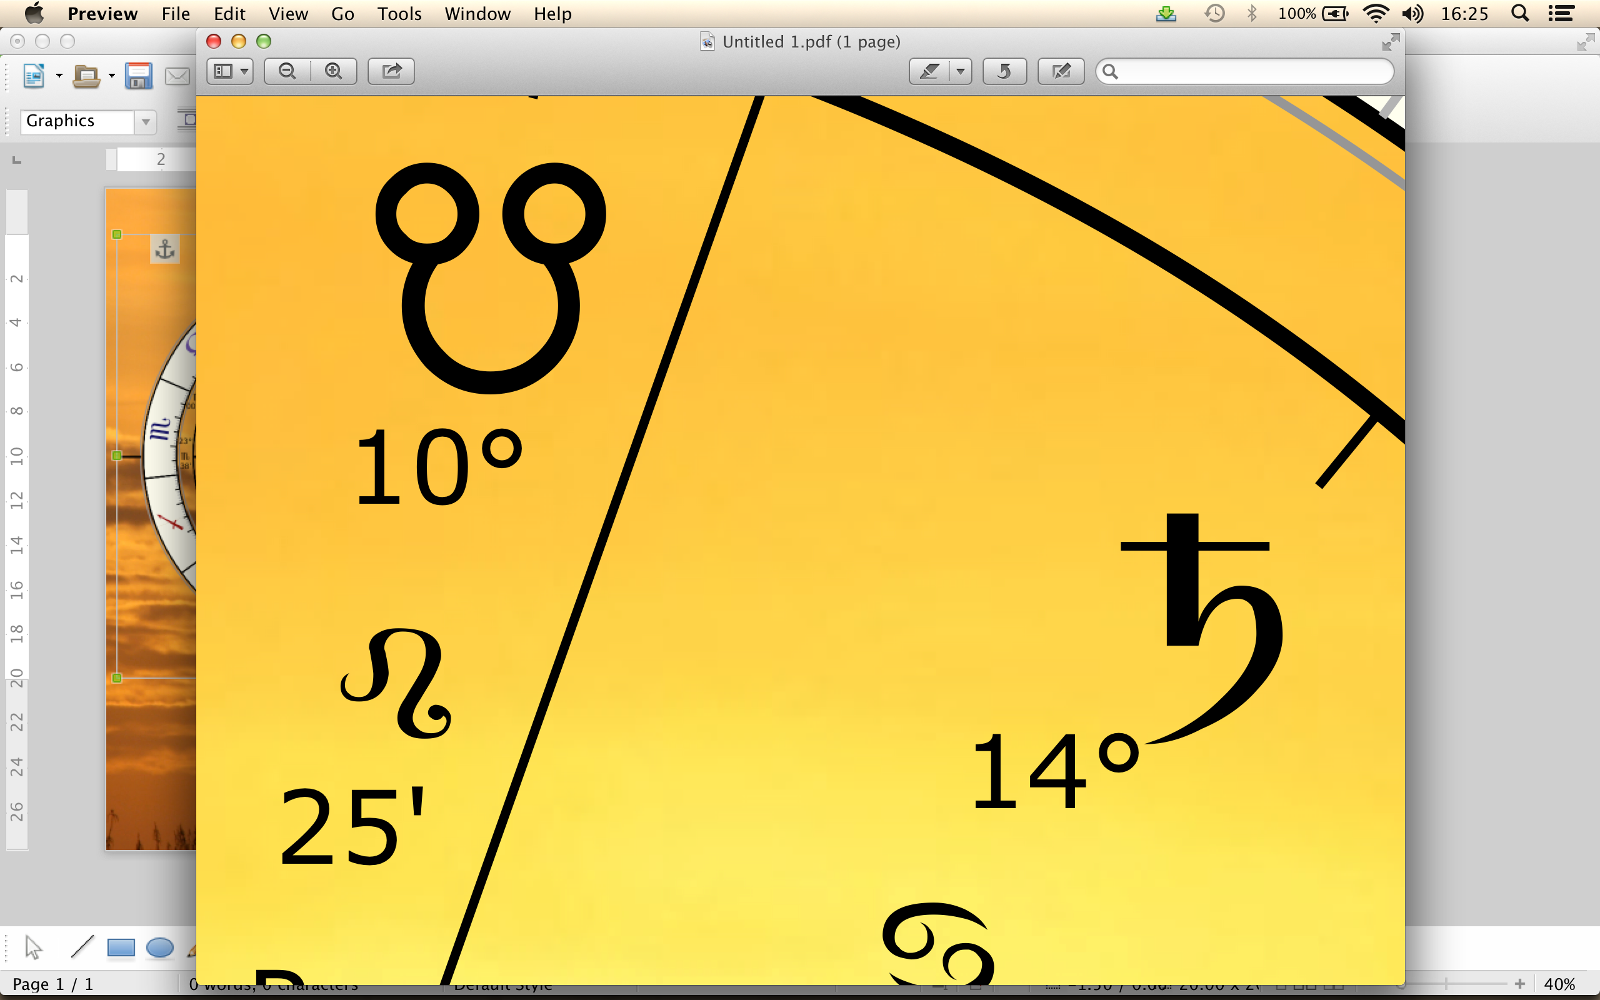
PDF files based on SVG charts scale perfectly.
You can download the generated PDF from this link.
2.6 - A small video tutorial
I've also created a small video tutorial which can be seen on Youtube.
Enjoy the Charts app!